How to Configure Perf Mon – Testing Disk IOPs

Configuring Performance Monitor (PerfMon) in Windows involves setting up monitoring for various system performance metrics and data collection. This can be very important to determine network speeds at the core layer or trying to determine data transfer rates. Another reason to leverage PerfMon is to determine storage devices disk IOPS for speed. Here’s a step-by-step guide on how to configure and use PerfMon to monitor system performance effectively:
1. Open Performance Monitor
Launch Performance Monitor:
- Press Win + R to open the Run dialog.
- Type
perfmonand press Enter.
Access Performance Monitor:
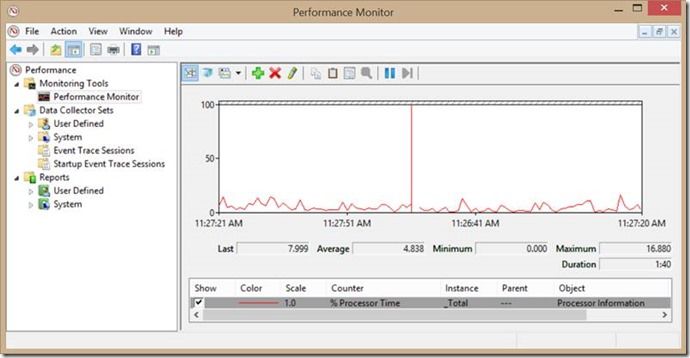
- In the Performance Monitor window, you will see the default performance graph. You can add various counters and configure data collection from here.
2. Configure Performance Counters
Performance counters are used to track specific performance metrics.
Add Counters:
- In the Performance Monitor window, click on the + button to add counters.
- In the Add Counters dialog, select the performance object you want to monitor (e.g., Processor, Memory, Disk).
- Choose the counters you want to track (e.g., % Processor Time, Available Memory).
- Select the instances (if applicable) to monitor (e.g., individual CPUs or disks).
- Click Add and then OK.
View Performance Data:
- The selected counters will appear in the graph, providing real-time data about system performance.
3. Configure Data Collector Sets
Data Collector Sets allow you to collect performance data over time and save it for later analysis.
Create a New Data Collector Set:
- In the Performance Monitor window, expand Data Collector Sets and right-click User Defined.
- Select New > Data Collector Set.
Follow the Wizard:
- Name: Enter a name for your data collector set.
- Create Manually: Choose Create manually (Advanced) and click Next.
- Select Data Type: Choose Performance counter and click Next.
- Add Counters: Click Add to select performance counters as described earlier. Click OK when done.
- Sample Interval: Set the sample interval for how frequently data should be collected.
- Log Format: Choose the format in which data will be logged (e.g., Binary, CSV).
- Finish: Review the settings and click Finish to create the Data Collector Set.
Start Data Collection:
- Right-click the new Data Collector Set under User Defined and select Start to begin collecting data.
4. Analyze Collected Data
Access Reports:
- Once data collection is complete, go to Performance Monitor > Reports > User Defined.
- Select the report for the Data Collector Set you created to view the collected data.
Generate and View Reports:
- Reports can be generated and saved for detailed analysis. You can view trends and performance issues based on the data collected.
5. Set Up Alerts
Alerts can notify you when specific performance thresholds are met.
Create an Alert:
- In the Performance Monitor window, expand Data Collector Sets > Alerts.
- Right-click User Defined and select New > Alert.
Configure Alert Settings:
- Name: Enter a name for your alert.
- Create Manually: Choose Create manually (Advanced) and click Next.
- Add Counters: Add the performance counters you want to monitor.
- Set Thresholds: Define the thresholds for the alert. Specify the conditions (e.g., when CPU usage exceeds 90%).
- Action: Configure the action that will be taken when the alert is triggered (e.g., log an event, run a script).
Finish and Save:
- Review the settings and click Finish to create the alert.
6. Review and Maintain
Regularly Review Performance Data:
- Periodically check the data collected by PerfMon to ensure your system is performing optimally.
Adjust Settings as Needed:
- Modify counters, data collector sets, or alerts based on changing requirements or observed performance trends.
By following these steps, you can effectively configure and use Performance Monitor to track and analyze system performance, helping you to maintain and optimize your Windows environment.


